Further Examples
Additional Jupyter notebooks with tutorials to produce the plots shown in the SPISEA paper (Hosek et al. (2020)) can be found here.
Figure 2: HR-Diagrams with Different Evolution Models; CMDs with different Extinction Laws
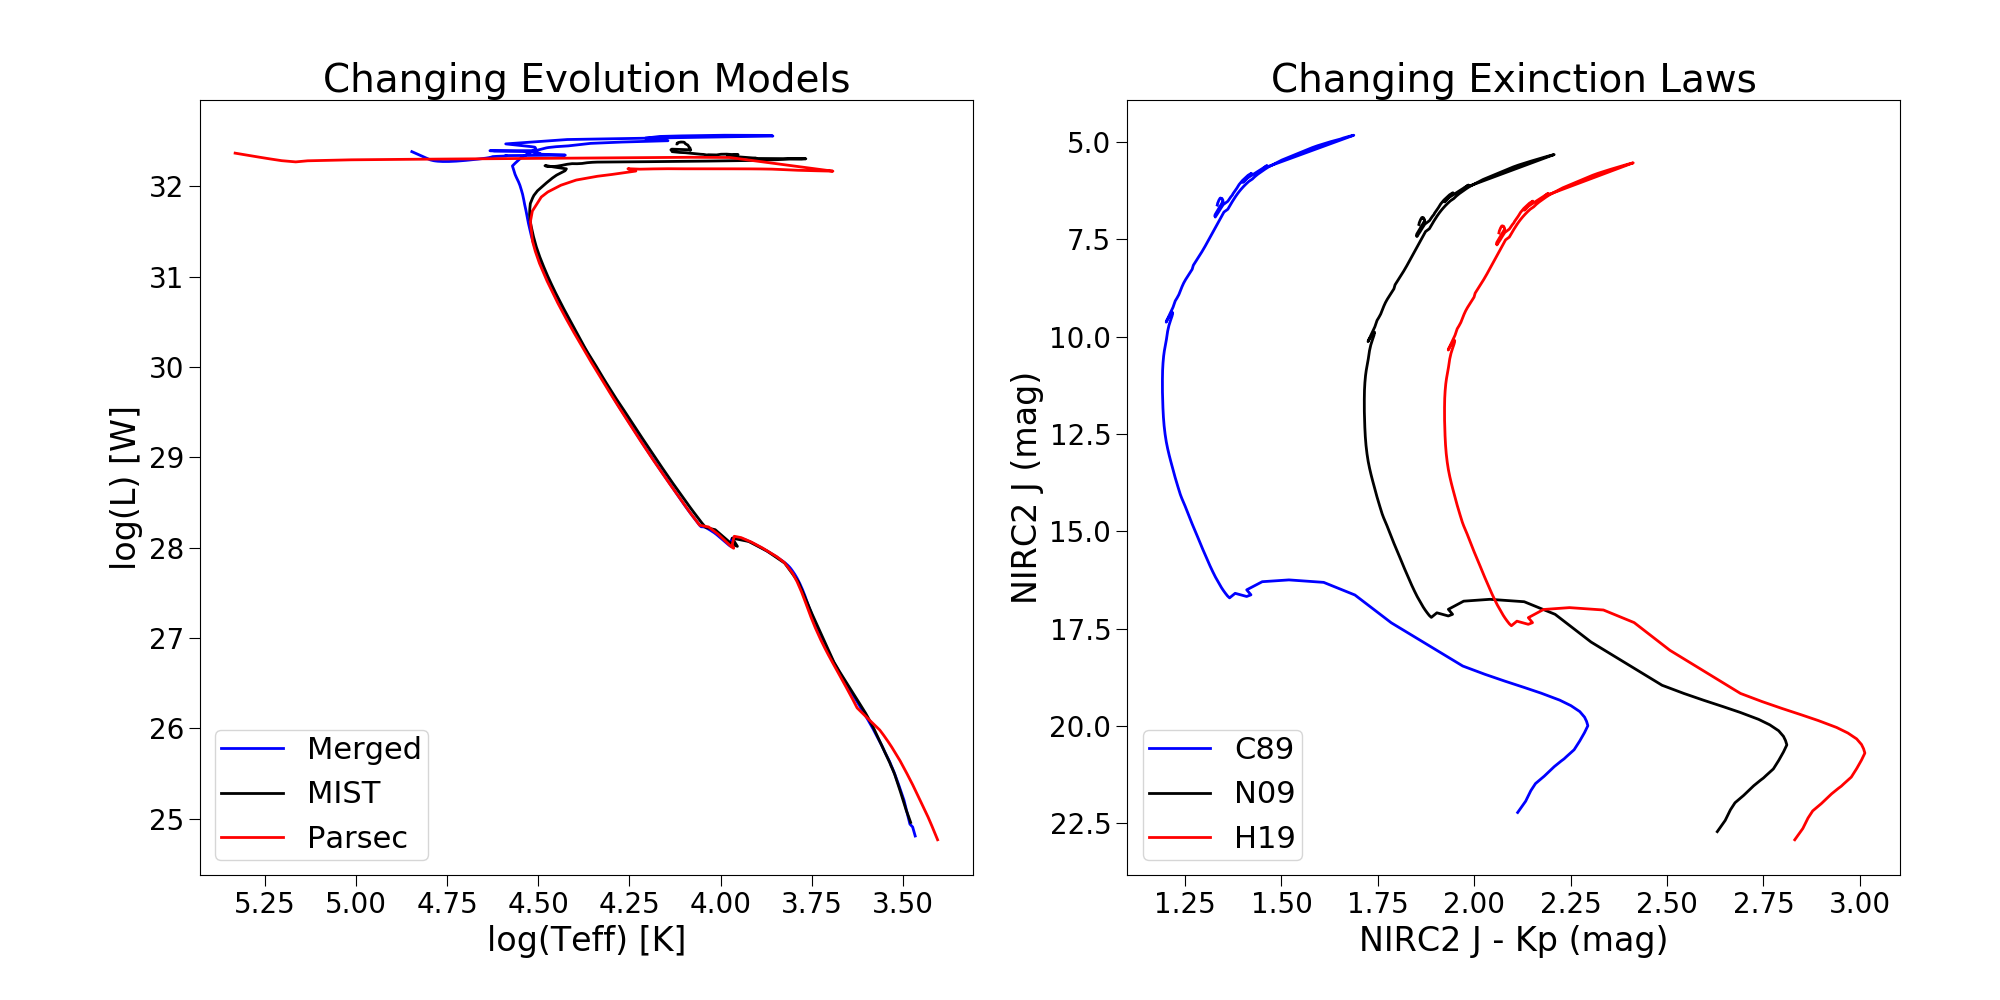
Figure 3: CMDs in Different Filters at Different Metallicities
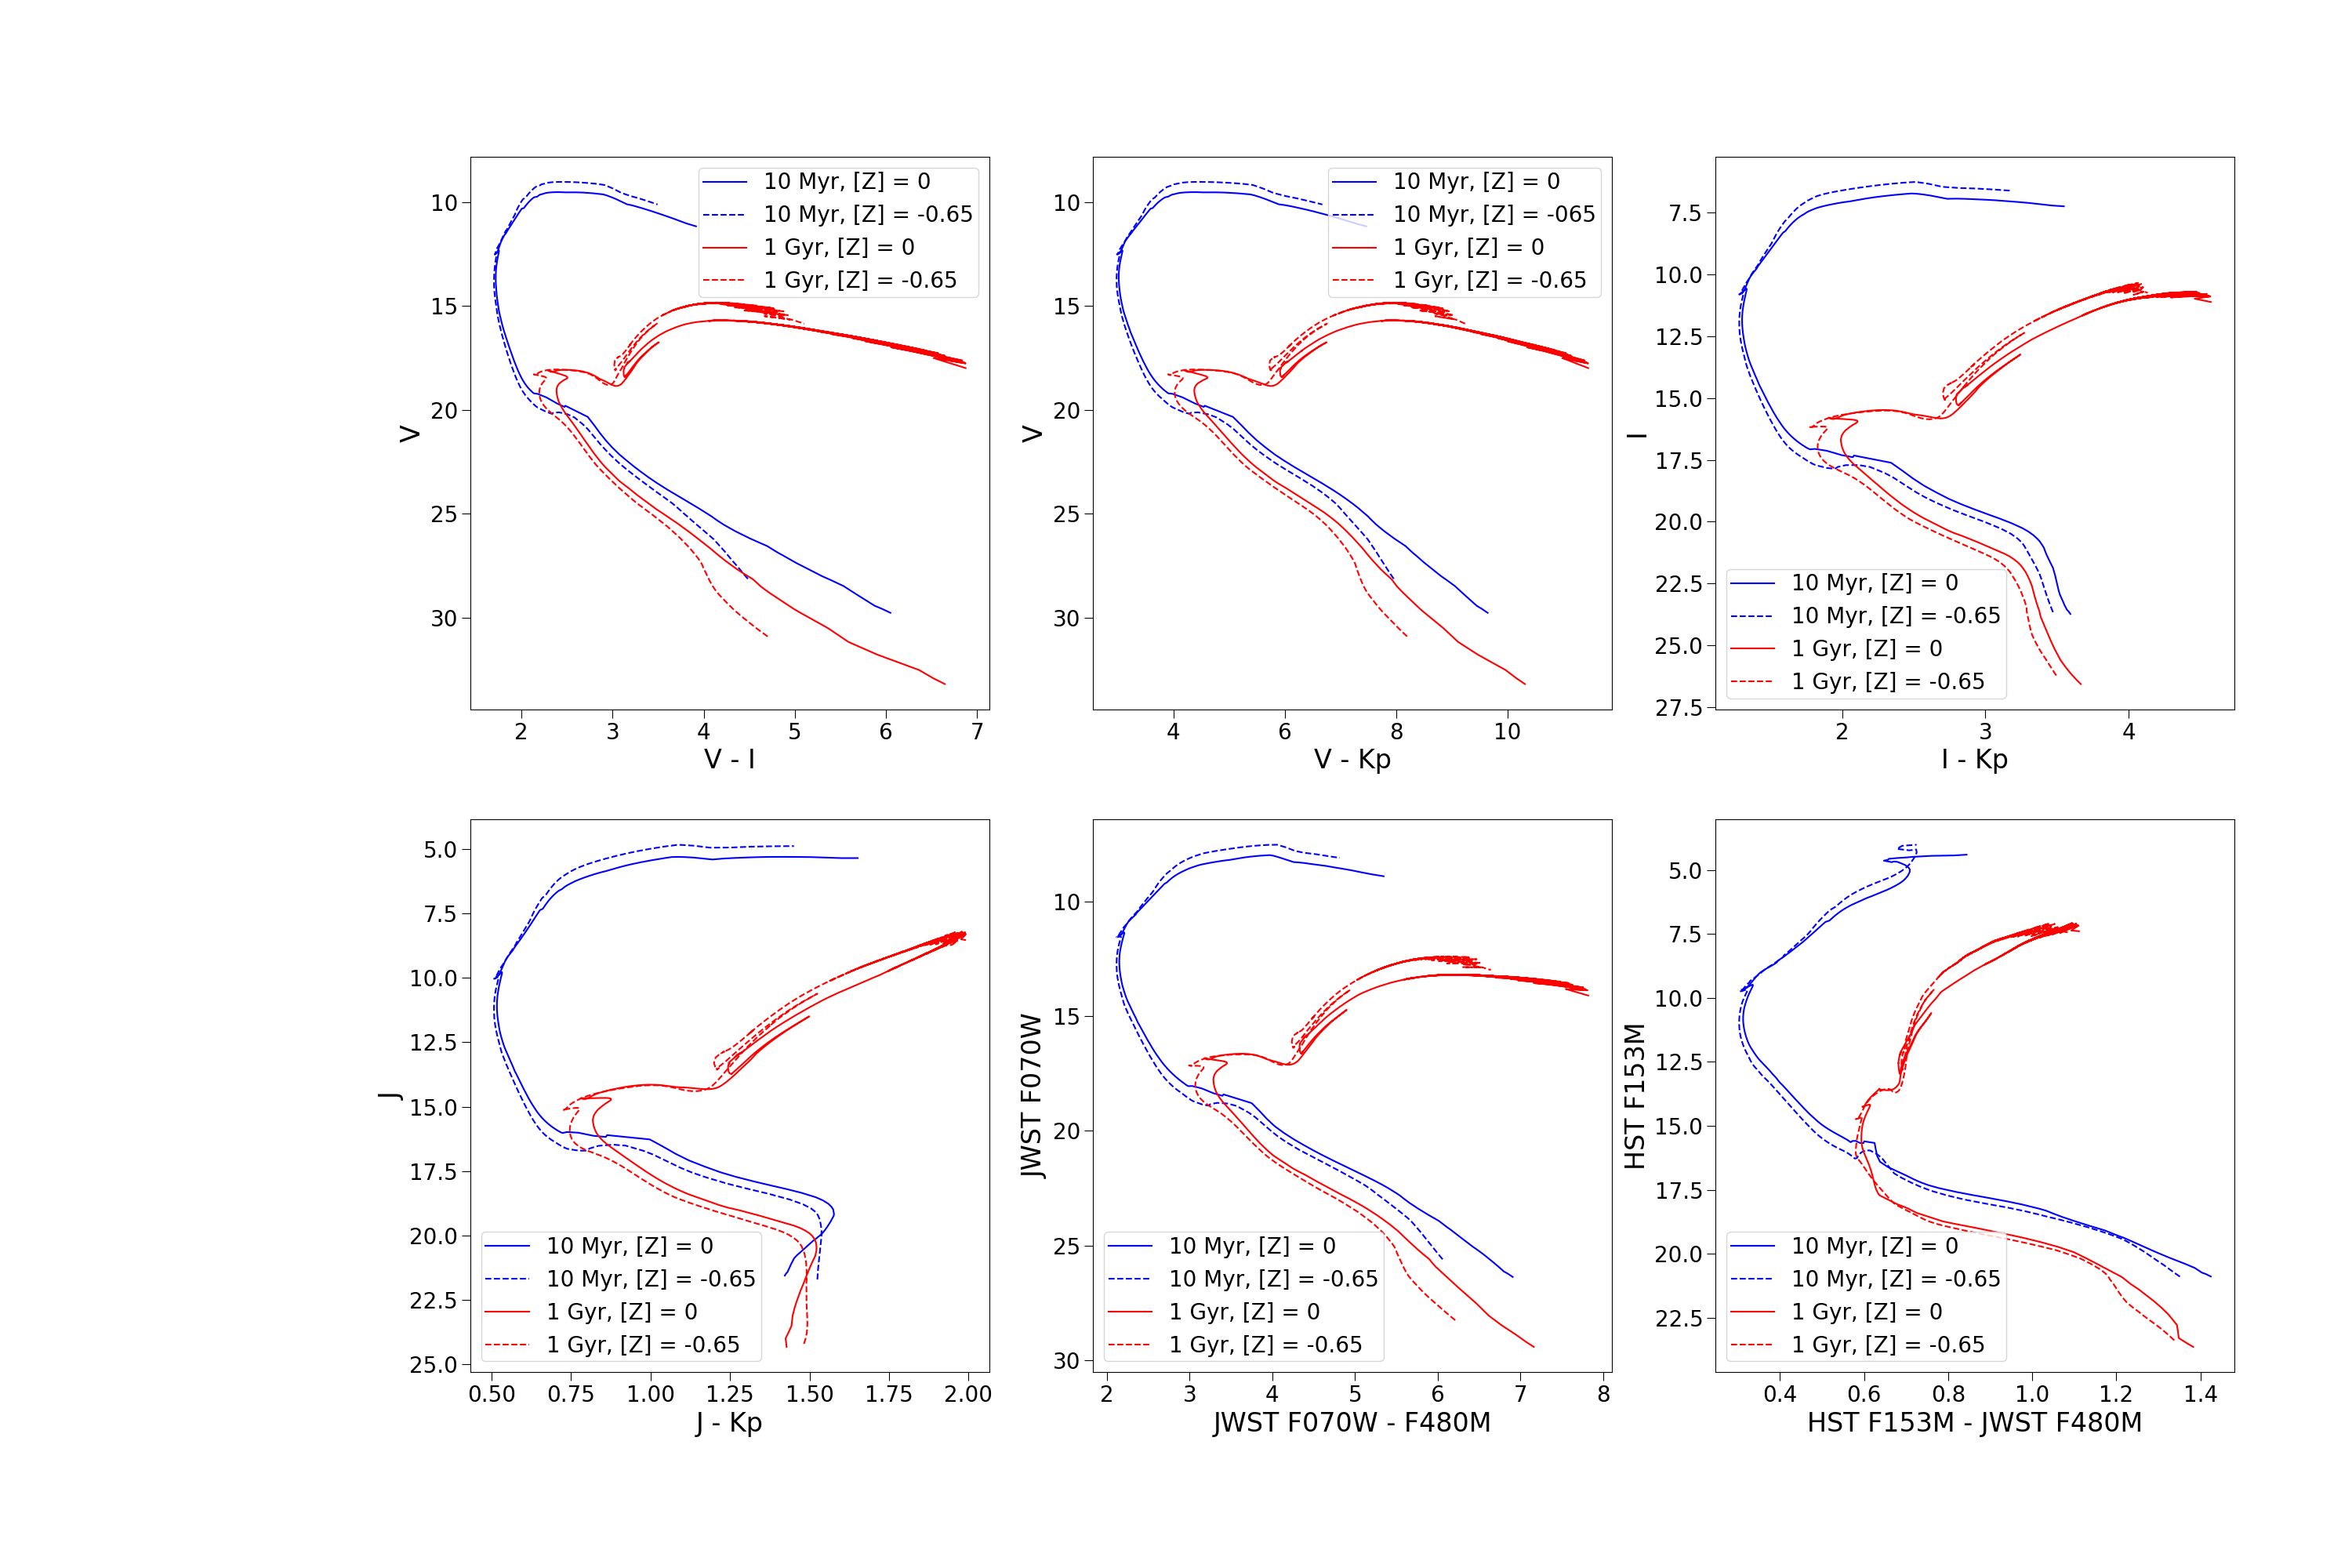
Figure 4: Clusters with Multiplicity vs. Differential Extinction
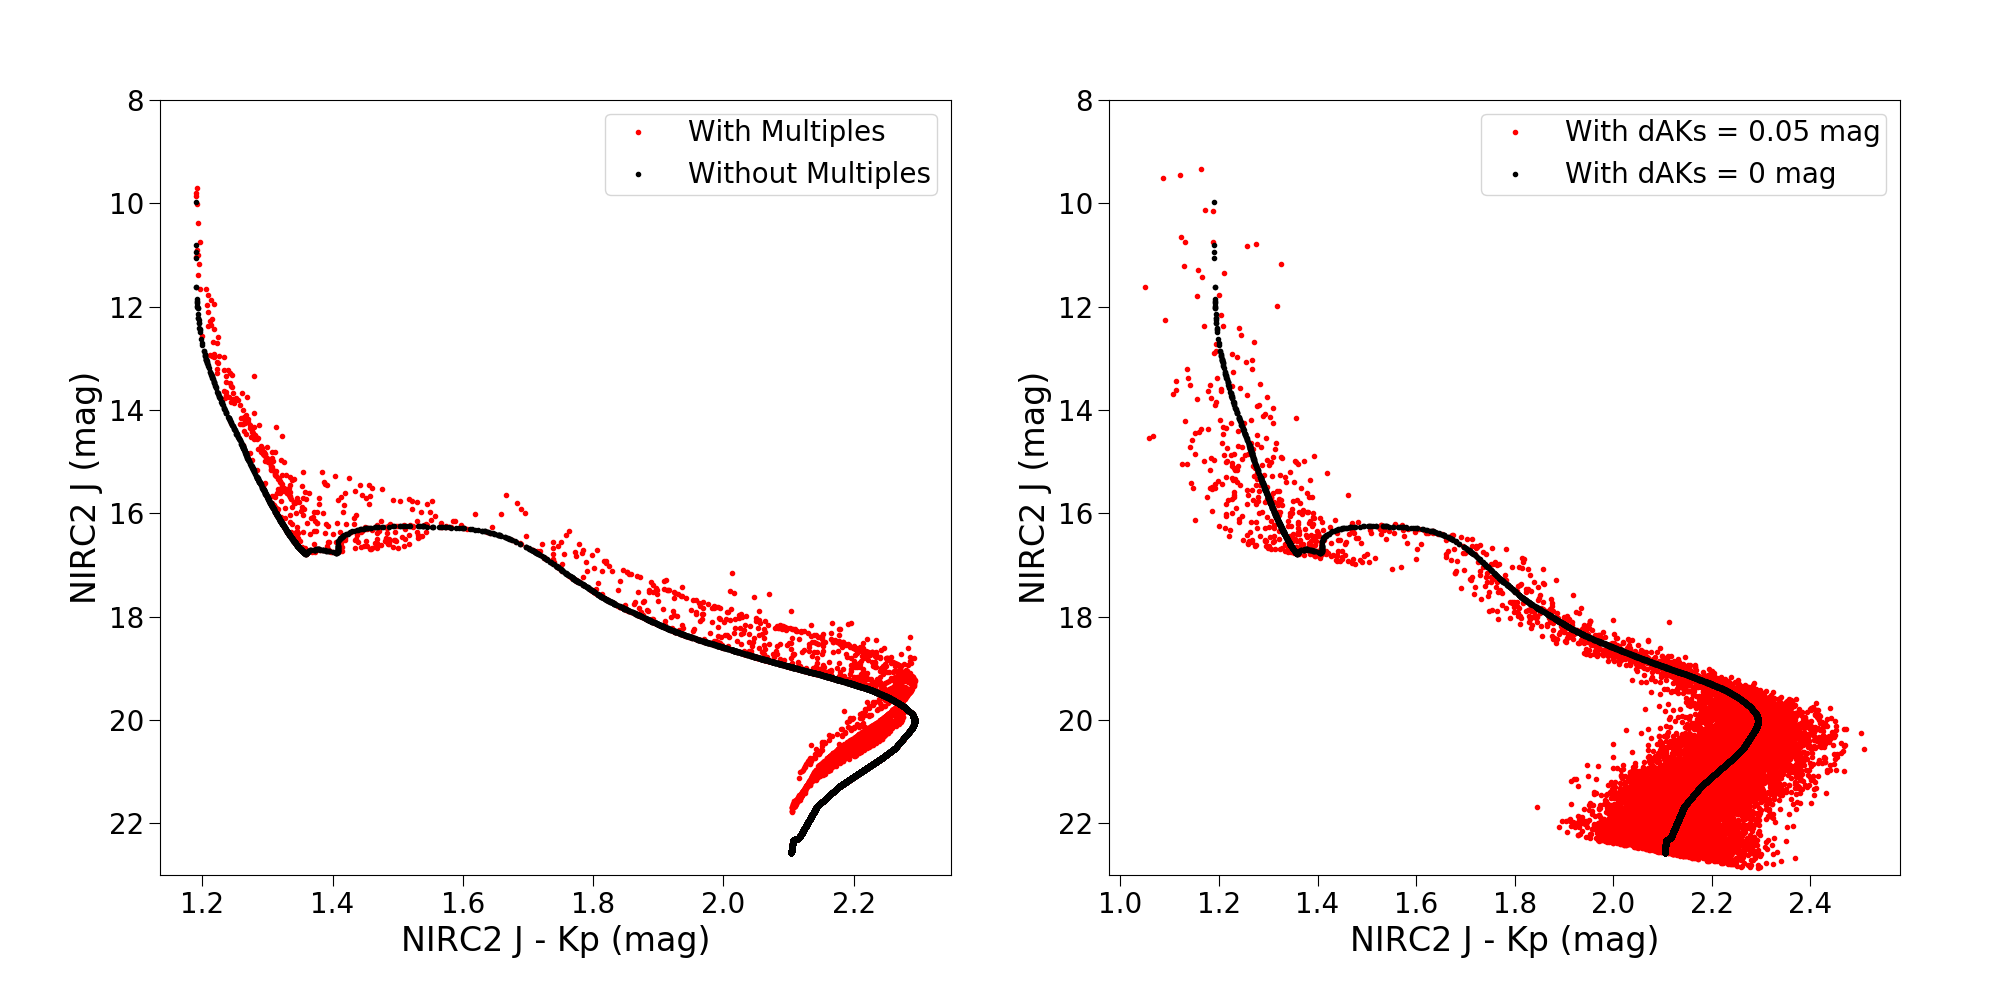
Figure 5: Clusters with Different IMFs: Luminosity Function + BH Mass Function
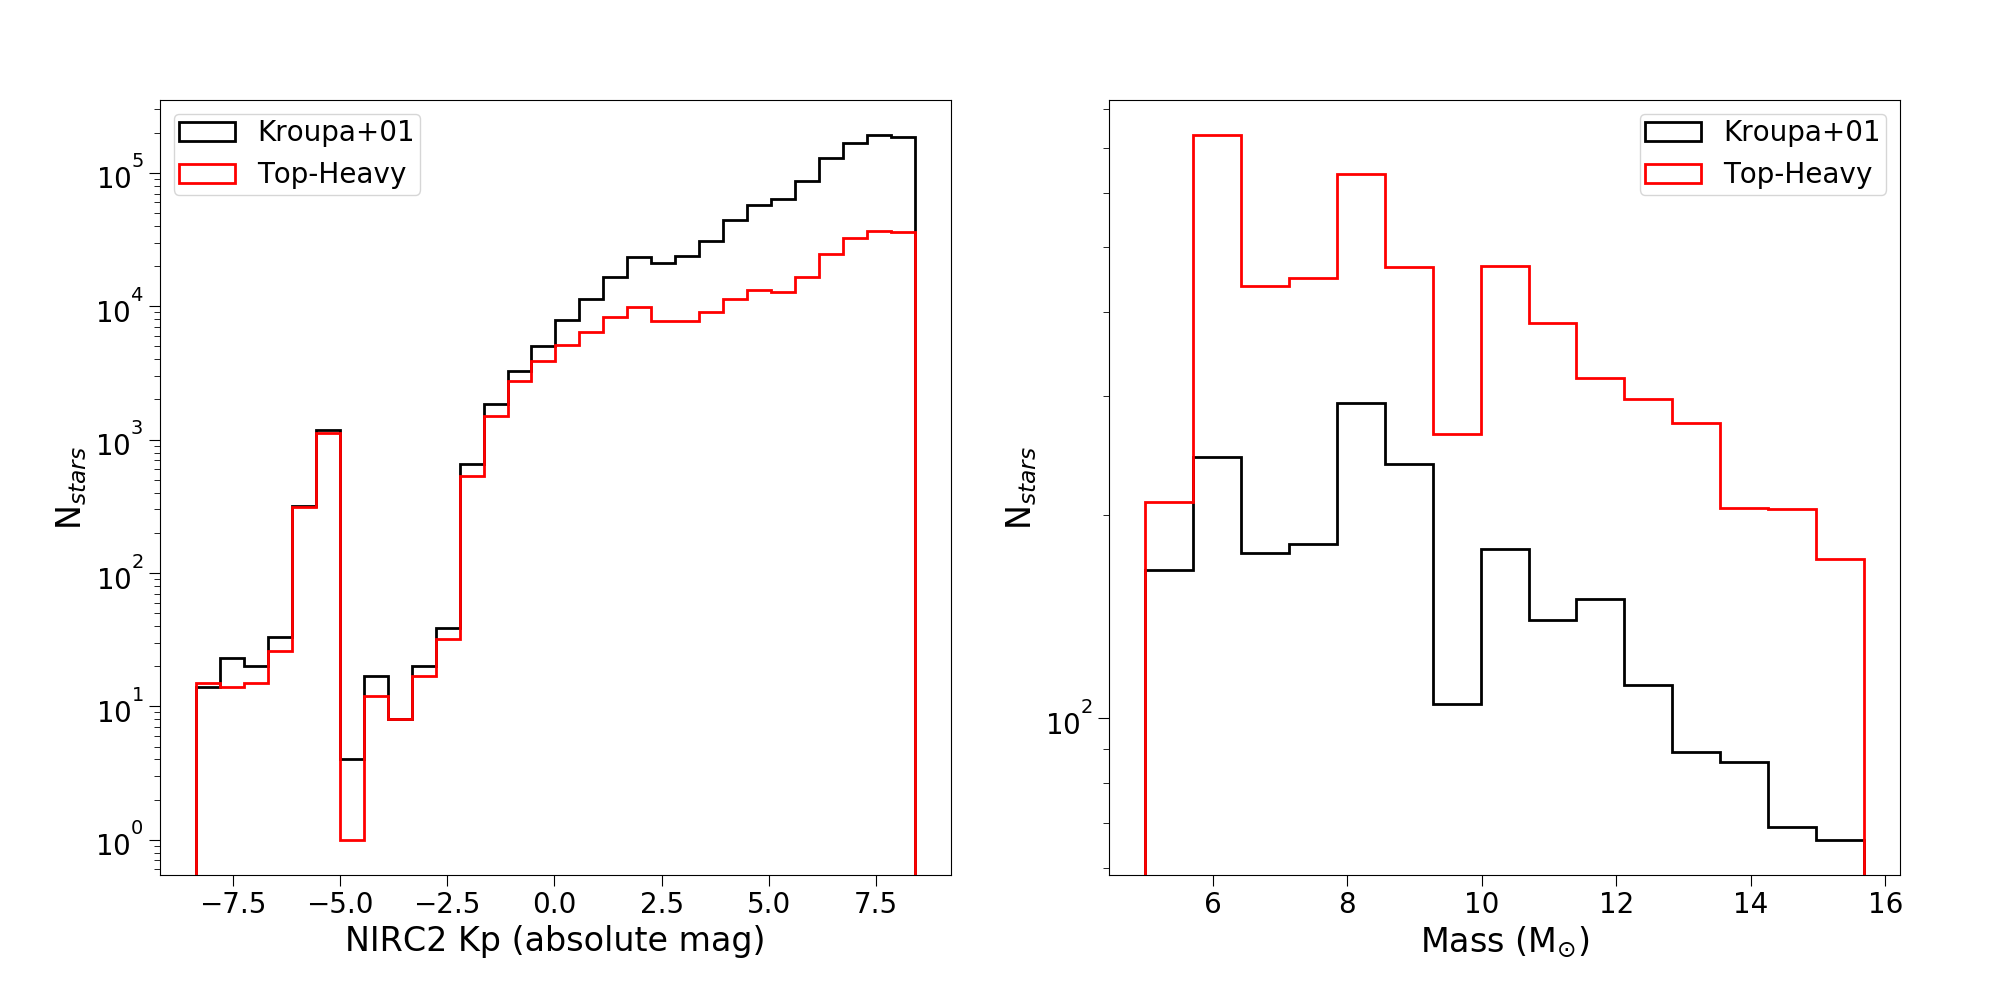
Figure 6: Wolf-Rayet Star Populations with Different Evolution Models
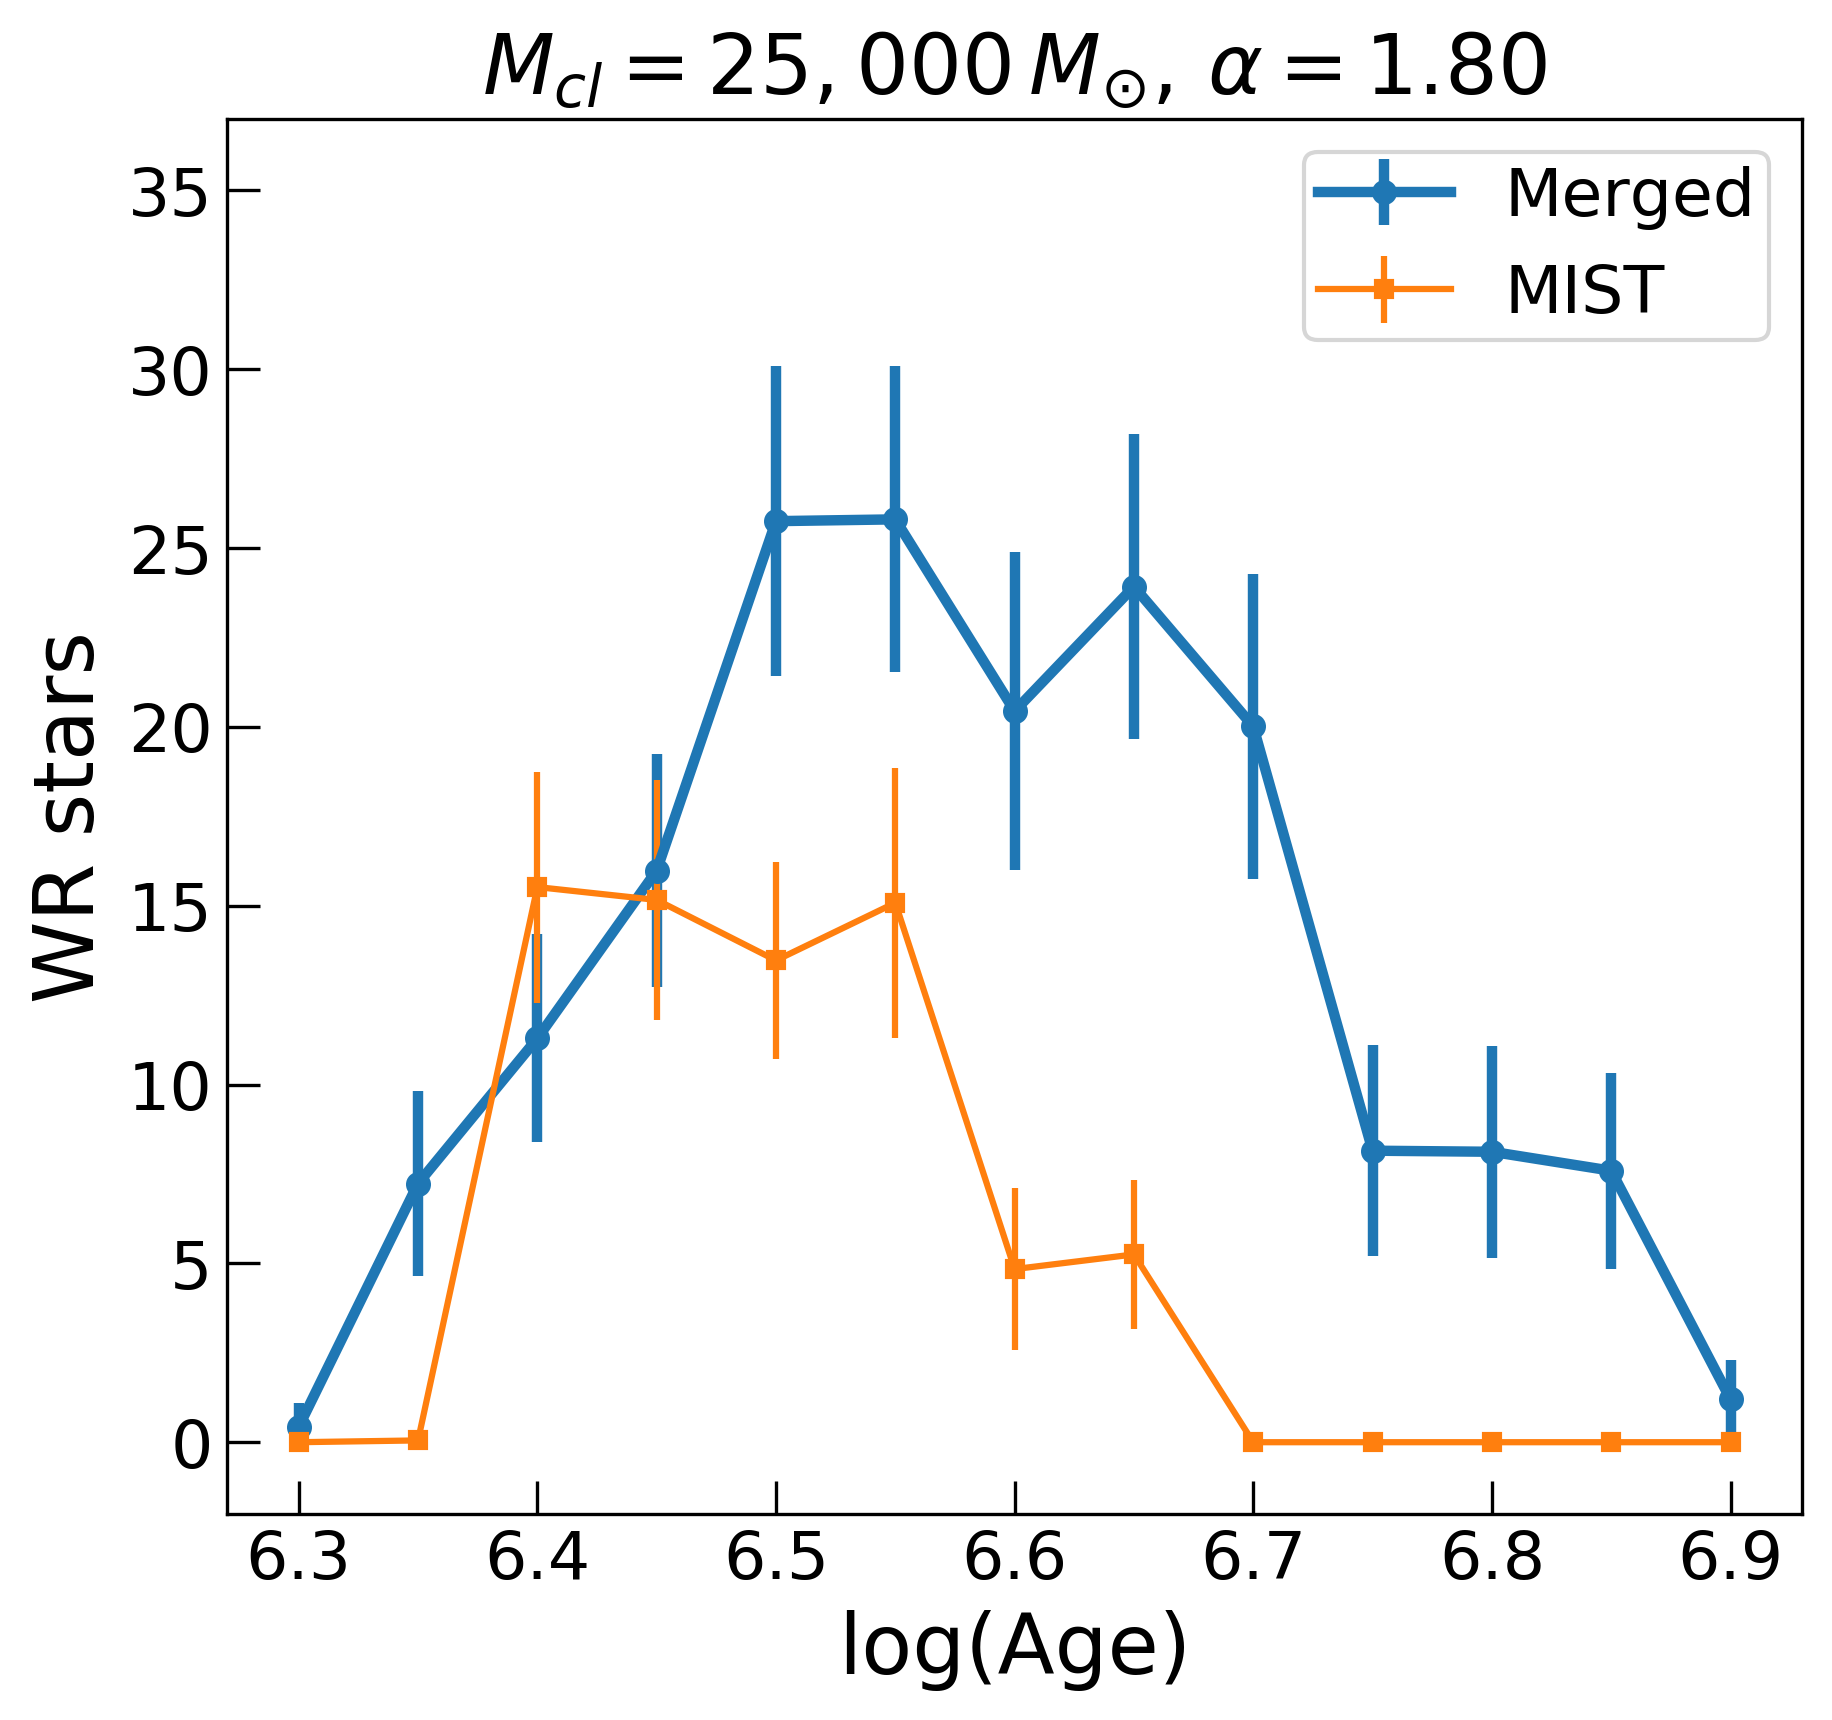
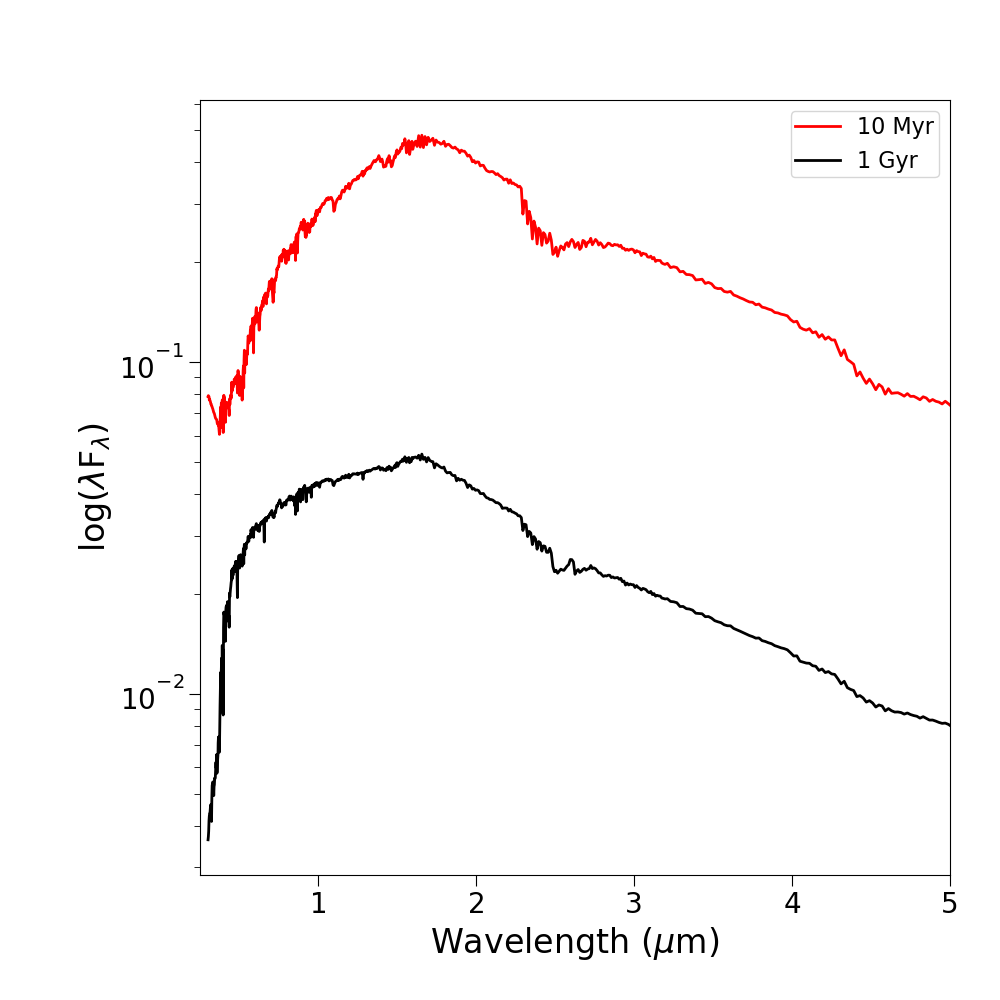
Figure 7: Unresolved Cluster Spectra at Different Ages